How much income do cultural and creative professionals earn?
A pilot study on income by occupation and industry code (Selected parts translated 2024-10-23)
- Startsida
- Om Konstnärsnämnden
- Publikationer
- Digitala publikationer
- How much income do cultural and creative professionals earn?
© Helena Shutrick

Obs! Publikationsinformation
Det här dokumentet är publicerat digitalt, på den här sidan hittar ni alltid senaste versionen av dokumentet. Om ni skriver ut dokumentet eller väljer att spara det som en PDF så finns det risk att informationen inte är av senaste slaget. Kontrollera därför alltid att ni har den senaste versionen av dokumentet genom att besöka den här sidan.
Slutet på Innehållsförteckningen
Publiceringsdatum: 2024-10-30 15:49
Uppdateringsdatum: 2024-11-08 16:15
Författare: Konstnärsnämnden tillsammans med Myndigheten för Kulturanalys
Illustrationer: Konstnärsnämnden
Layout: Konstnärsnämnden
Adress: Maria Skolgata 83, Stockholm
Kontakt: Peter Gahnström
Innehållsförteckning
Introduction
The Swedish Arts Grants Committee is tasked with analysing and disseminating information about the social and economic situations of artists, as well as regularly tracking the development and application of the social security system in relation to professional artistic practice. It is also tasked with monitoring the conditions for running a business as an artist in the cultural and creative sectors (CCS). In addition, the agency is expected to collaborate with relevant authorities, institutions, civil society organisations and other stakeholders involved in activities that have a significant impact on the living and working conditions of artists.
The Swedish Agency for Cultural Policy Analysis is responsible for providing official statistics on the cultural sector. It has a broad mandate to conduct evaluations, analyses and reports on the impacts of proposals and measures in the field of culture in accordance with national objectives for cultural policy. This mandate includes analysing developments in the cultural sector. The agency must provide the government with data and recommendations that can be used as a basis for policy development and review.
The diverse skill sets of the two agencies provides a wide range of expertise that is considered in the selection of methods and the final assessments.
Problem statement
The number of permanent jobs is relatively low among creative professionals. Instead, the labour market is characterised by fixed-term employment and commissions, and it is common for cultural and creative professionals to have multiple employers, clients or both. Self-employment is widespread and often combined with income from employment. Income is often unpredictable and varies during the year and between different years. Cultural and creative professionals as a group tend to have higher education levels compared with other occupations in the labour force. As a result, their overall income is often complex compared with many other occupational groups among other gainfully employed individuals in the population.1
To effectively monitor the working conditions of cultural and creative professionals at the core of the cultural and creative sectors, we need to gain a better understanding of the sources and distribution of their income based on factors such as occupation, gender, age and background.
Background
Cultural and creative occupations according to statistics
Using the method we developed and presented in our collaborative study from 2022, Yrkesverksamma konstnärer i SCB:s register (Professional artists in Statistics Sweden’s registers), we describe how we established a population using the Swedish Standard Classification of Occupations (SSYK codes) and Swedish Standard Industrial Classification (SNI codes) based on the national definition of cultural and creative sectors (CCS) from the Kreameter.2
In the 2012 ESSnet Culture project, Eurostat, which is the statistical office of the EU, defines cultural and creative occupations. Eurostat bases its definition on a categorisation into twelve cultural domains,[Footnote] with a broad range of fields covering heritage, archives, libraries, books and press, visual arts, performing arts, multimedia, architecture, advertising and art crafts.3 In the Kreameter, which contains corresponding Swedish statistics on the cultural and creative sectors, the international industry and occupation codes are translated into Swedish SNI[Footnote and SSYK4 codes. The Swedish definition also includes the fashion industry and four additional SNI codes that were assessed as belonging to the cultural and creative sectors in Sweden. Our population is a cross-section of the Kreameter and consists of individuals who have creative occupations and thus largely constitute the creative core in the cultural and creative sectors.
The creative core in cultural and creative sectors
The creative core consists of people whose activities are based on or consist of artistic creation or expertise. The group of cultural creative professionals includes artists who make up the target group for government arts policy initiatives. But the group is larger than this, also including industrial and graphic designers in the advertising industry – professions not covered by cultural policies to the same extent.
Figure 1 illustrates how the level of artistic involvement by actors in the creative core varies across different types of CCS activities. Put simply, more centralised activities (the inner circle) have a greater degree of uniqueness in terms of the aesthetic quality and expertise put into individual products and services that form the foundation of the cultural and creative sectors.

Ongoing policy efforts for cultural and creative sectors
The focus of EU institutions’ cultural policy efforts is on the working conditions of creative professionals. The Council of Ministers’ Work Plan for Culture 2023–2026 prioritises the working conditions of artists and cultural professionals in the cultural and creative sectors. The Council of Ministers has tasked the European Commission with developing actions for the coming period. In the report The status and working conditions of artists and cultural and creative professionals, experts from the Member States have put together recommendations that aim to improve conditions for artists and other creative professionals.5
In spring 2024, the Swedish government presented a strategy6 for businesses in the cultural and creative sectors. The strategy outlines the need to develop statistics for these sectors – something this pilot study hopes to contribute to by focusing on the development of statistics about cultural creative professionals who work in the cultural and creative sectors.
Methodology and delimitation
This pilot study uses a population of people active in the occupations and sectors defined in the study Professional artists in Statistics Sweden’s registers – a methodological study based on occupational and industry codes.7
The population studied consists of individuals aged 16–65 who were gainfully employed and registered in Sweden on 31 December of the years examined. A person was considered gainfully employed if they had an income from wages that exceeded a taxable threshold amount8 or if they were actively engaged in business activity. The classification of gainfully employed individuals was based mainly on income statement and tax return data from the Swedish Tax Agency.
The data used were retrieved from Statistics Sweden’s LISA database, a longitudinal integrated database for health insurance and labour market studies.9 We have supplemented the LISA data with data from income statements and employers. All the data used were de-identified and stored with Statistics Sweden. The study examines the years 2019 and 2021. In the pilot study, we also compared the income of the gainfully employed group of creative professionals with that of other gainfully employed individuals aged 16–65 during the 2021 tax year.
The group of cultural and creative professionals
To create a population of creative professionals, we have used both occupation codes (SSYK codes) and industry codes (SNI codes). We have chosen to use occupation codes in the first instance because we want to follow cultural and creative professionals regardless of whether they received their income from work in a creative activity (SNI 90.01 and 90.93) or not (see under the heading “Creative sectors” p.9).
However, many cultural and creative professionals are self-employed, meaning that they run their own business. Although sole proprietorships are the most common form of enterprise among this group, some individuals have a trading partnership or their own limited company. Those who are self-employed generally lack an occupation code because they run a company. Therefore, as a complement to the population with occupation codes, we have used industry codes and added self-employed persons active in the cultural and creative sectors.
Creative occupation codes
Among the SSYK codes are 31 occupational categories that align with the cultural and creative professions as defined in Sweden’s Kreameter. Since we want the pilot study to focus only on those who work in an artistic and creative profession and not everyone employed in cultural and creative sectors, we have selected 15 occupation codes from the 31 categories and grouped them into 12 occupational areas.
The professionals and their occupations have been determined by identifying the two largest sources of income in a year as well as income in November. People who do not have an artistic and creative profession but work in cultural and creative sectors are usually classified according to the Creative Trident model10 as support staff in the arts and culture. We have excluded these people from our survey unless they were self-employed artists or owners of closely held corporations. Figure 2 shows a matrix representing employment in cultural and creative sectors, with the grey row indicating the areas where our population is concentrated.

Table 1 shows the occupation codes selected and their grouping into twelve occupational areas. The SSYK codes cover various occupational activities that cannot be statistically analysed individually. Both the classification and naming of the occupational areas differ to some extent from those usually used by the creative professionals’ trade organisations themselves and the classification used by the Swedish Arts Grants Committee in previous reports.11

Creative sectors
The pilot study delimits creative sectors using two industry codes, performing arts (SNI 90.01) and artistic creation (SNI 90.03). We assess that individuals who are self-employed and active in these two sectors are highly likely to be cultural and creative professionals in one of the defined occupational areas.

Another requirement for self-employed individuals to be considered part of the population is that they must earn at least 25 percent of their income from one of these two creative activities. We believe this level is reasonable, since many creative professionals at times have irregular incomes that are often supplemented by income from sectors other than these two creative ones.
Occupational areas
We have divided individuals who have a registered creative occupation code into twelve occupational areas. Table 1 shows which occupational areas belong to the different categories. An additional area has been added for the self-employed who do not have an occupation code and are active in a creative activity (see Table 2). The following tables and figures in the report are based on this categorisation.
Creative occupational areas
- Industrial design
- Publications and media
- Online games and media design
- Fashion design
- Writing
- Visual arts
- Music
- Directing and production
- Performing arts12
- Photography and film
- Set design and decoration
- Handicrafts
- Solo entrepreneurs without an occupation code (who are active in CCS)
Composition of the occupational group
This chapter provides some background variables on the group of cultural and creative professionals. We have looked at this occupational group’s size, number of individuals by occupational area, and percentages by gender, age and background. Comparisons are made between the years 2019 and 2021.
The occupational group as a whole
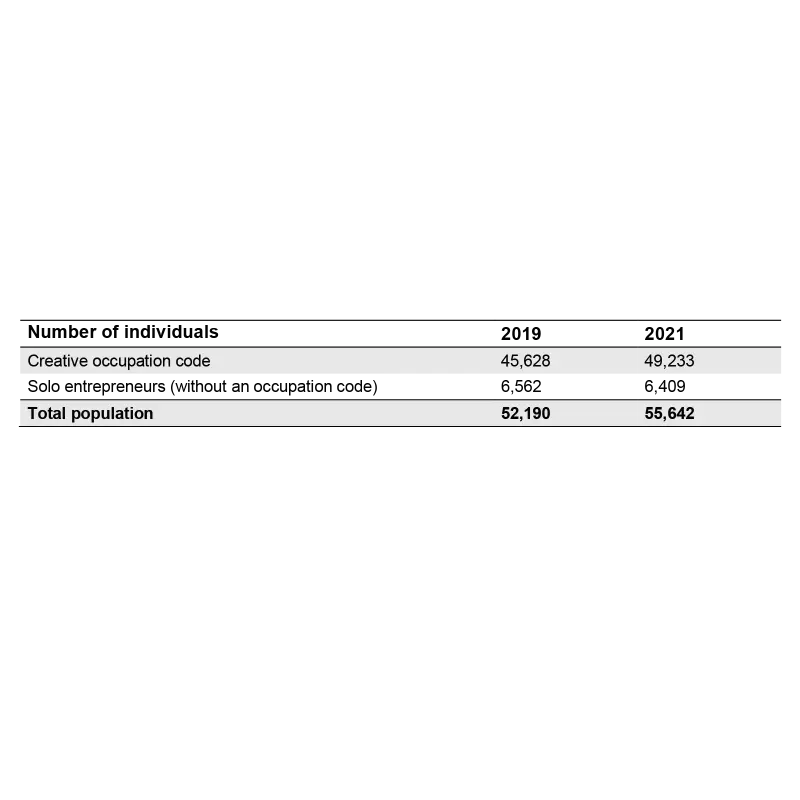
The occupational group delimited as described in the previous chapter consisted of 55,642 individuals in 2021. Of these, 49,233 individuals were identified by creative occupation codes. The remaining 6,409 individuals were identified by their income from business activities in a creative sector (SNI 90.01 and 90.03). Since 2019, the total number of people in employment has increased by around 6 percent, from 52,190 to 55,642.
Occupational group by occupational area
The three largest occupational areas in 2021 were, in descending order, publications and media (8,956), music (7,493) and Solo entrepreneurs (6,409). The smallest areas were, in ascending order, writing (1,814), visual arts (1,886) and handicrafts (1,903).
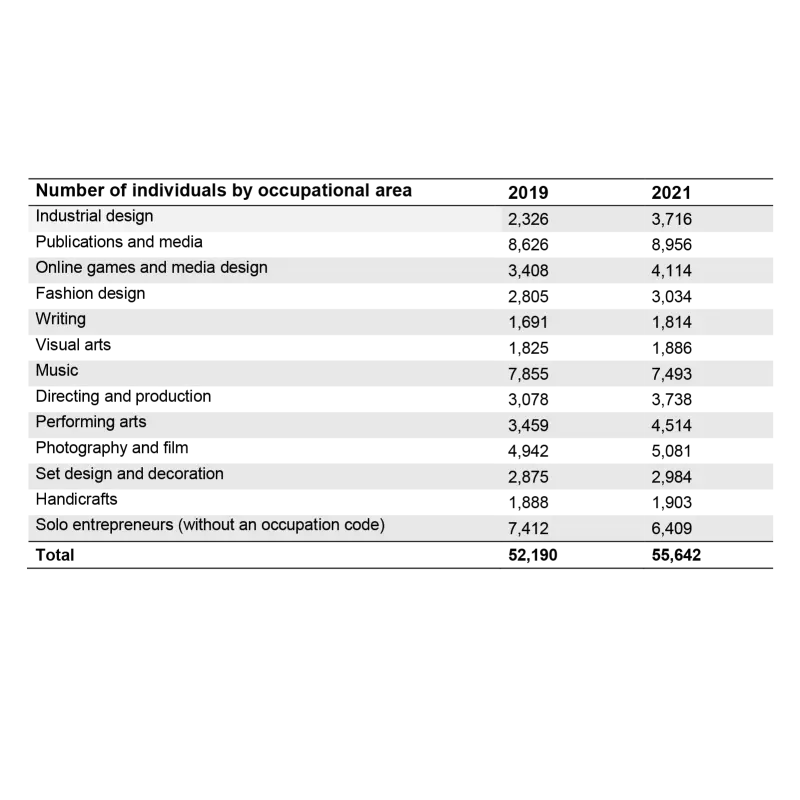
The largest increase between 2019 and 2021 was in the occupational area industrial design, where the number of individuals increased by 60 percent from 2,326 to 3,716. The next largest increase was in the area performing arts, with an increase of 31 percent from 3,459 to 4,514 individuals. In contrast, the number of individuals in the area solo entrepreneurs fell by 14 percent from 7,412 to 6,409.
Occupational group by sex
In 2021, the occupational areas with the highest percentage of women were set design and decoration, at approximately 80 percent, followed by fashion design, at about 65 percent. The highest percentage of men worked in online game and media design, at 73 percent, and industrial design, at 71 percent. The performing arts area was the most gender-equal, with women representing 49 percent.
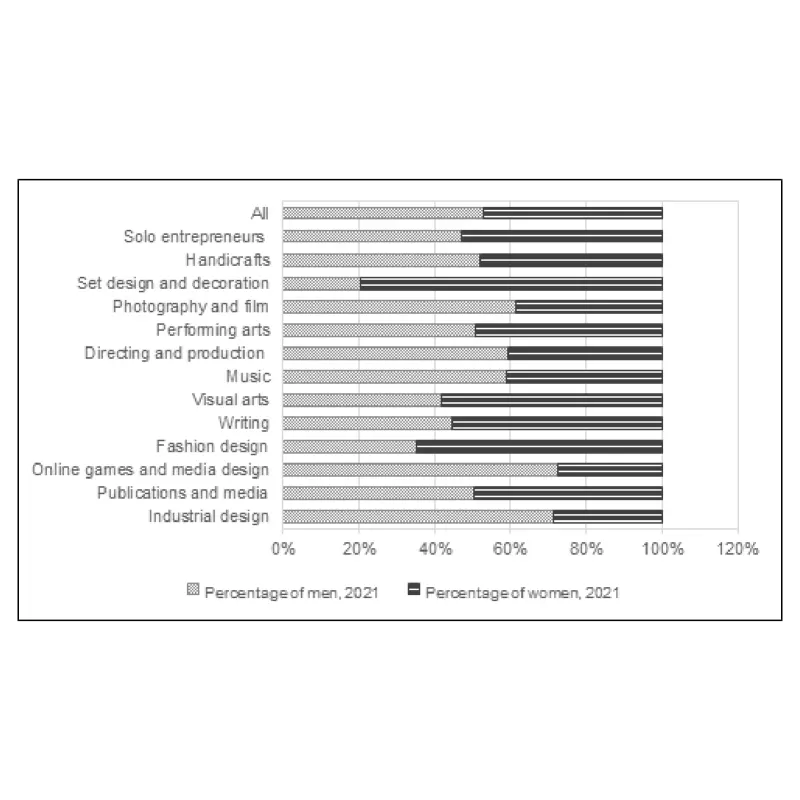
The biggest changes between 2019 and 2021 were in the area industrial design, where the proportion of men increased by 4 percentage points, making the occupation even more male-dominated. The same change was observed in the area visual arts, where the share of women increased by 4 percentage points.
Occupational group by age
The occupational area with the highest number of young people in 2021 was online game and media design, with 85 percent of workers under the age of 45. On the other hand, writing and handicrafts had the highest proportion of older workers, with 61 percent of them aged 45 or over.
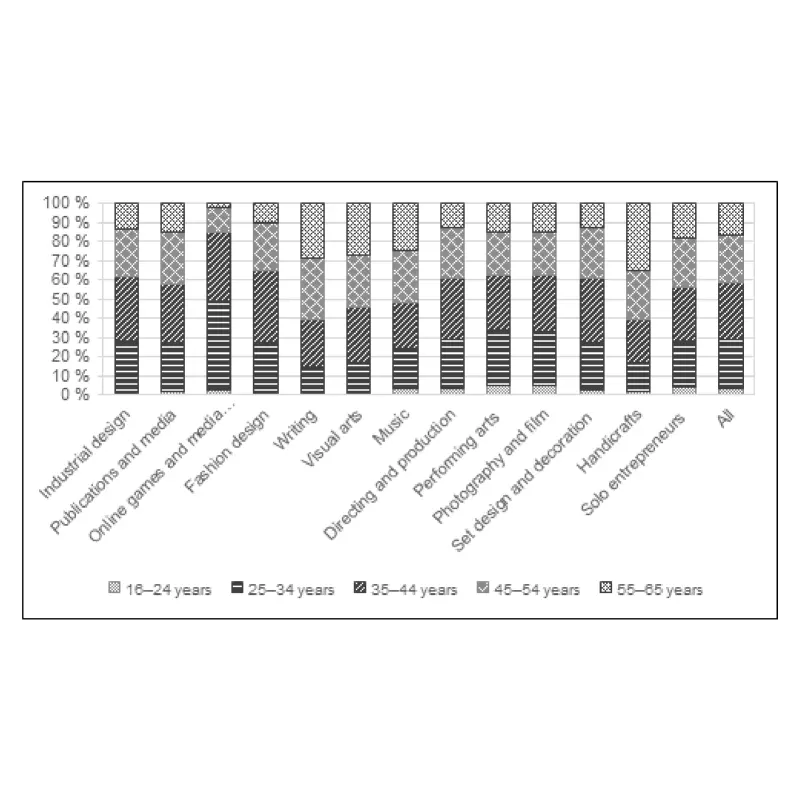
Between 2019 and 2021, there were no major changes across age groups. However, it is worth noting that the percentage of workers in the 25–34 age group decreased in all occupational areas except for industrial design, which saw a 1 percent increase, and visual arts, which remained unchanged.
Occupational group by background
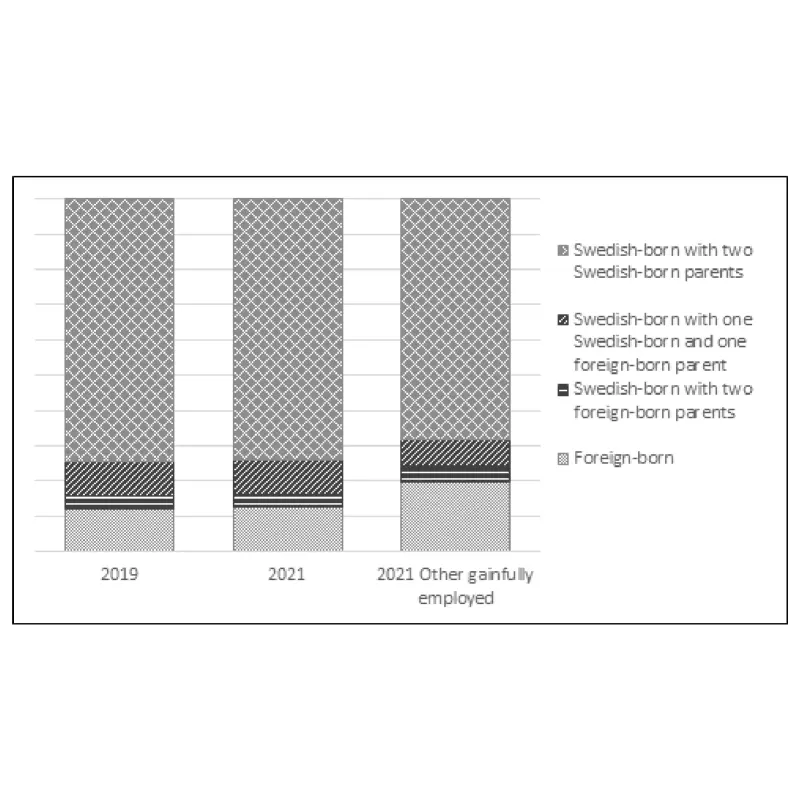
There were small changes between 2019 and 2021 within the overall occupational group by background. If the group of cultural and creative professionals is compared with other gainfully employed, the proportion of those born in Sweden with one parent born in Sweden and one foreign-born parent (+2.6 percentage points) and those born in Sweden with two parents born in Sweden (+5.5 percentage points) was higher. On the other hand, the share of foreign-born persons was lower in the occupational group compared to other gainfully employed individuals.
Total earned income by occupational area
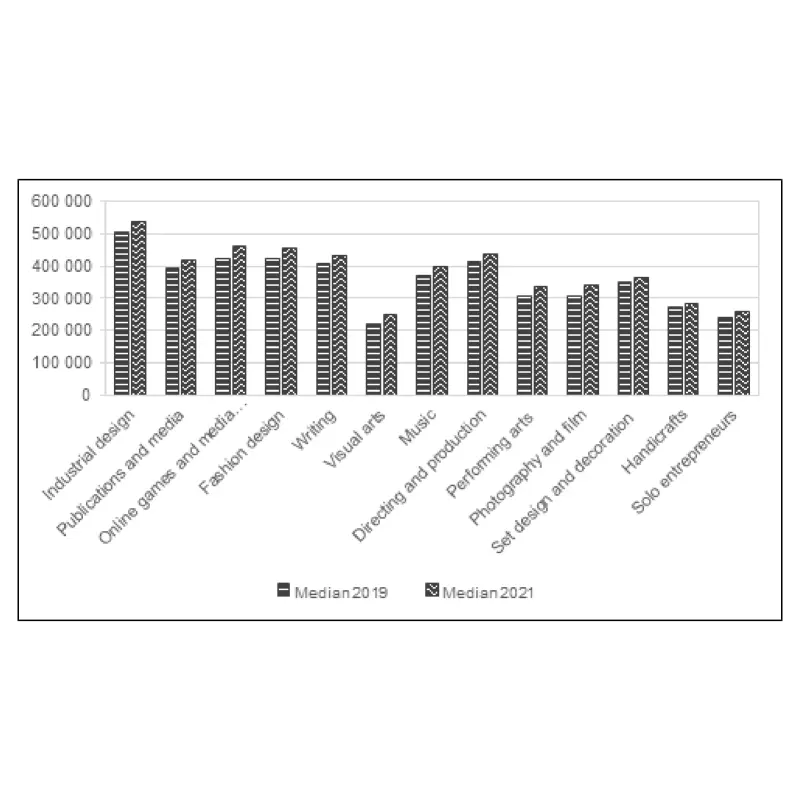
Figure 7 describes the median distribution of total earnings by occupational area in 2019 and 2021. In 2021, those working in the occupational area industrial design (SEK 537,400) had the highest median earnings, followed by fashion design (SEK 456,200) and online game and media design (SEK 462,100). The lowest earnings were in the area’s visual arts (SEK 248,900) and solo entrepreneurs (SEK 283,700).
Results and analysis
Using the population produced by the Swedish Arts Grants Committee and Swedish Agency for Cultural Policy Analysis in the methodological study Professional artists in Statistics Sweden’s registers, we are now taking a further step in developing statistics on cultural and creative professionals working in the cultural and creative sectors.
The purpose of this pilot study is to improve our understanding of the income composition of cultural and creative professionals in the creative core of the cultural and creative sectors. Because their incomes vary in size, and are derived from both employment and self-employment with different employers and clients, the overall income profile is more intricate than many other occupational groups among other gainfully employed individuals. For this reason, we need new statistical methods that can accurately depict the total income earned by cultural and creative professionals and enable us to track their incomes over time.
Some overall results
Total earned income
Total earnings for the group of cultural and creative professionals as a whole increased by 9 percent between 2019 and 2021, with the median value in 2021 being SEK 390,900. For the entire group of creative professionals, earnings were marginally higher than for other gainfully employed individuals. The median earned income was 13 percent higher for men than for women. There were large disparities among the different occupational areas; industrial design had the highest earnings, with a median of SEK 537,400, while handicrafts had the lowest, at SEK 283,700. The highest earnings were in the 45–54 age group, with a median of SEK 434,650. Among those who were foreign-born, earnings were approximately 14 percent higher in the creative group than for the corresponding group among other gainfully employed individuals.
Income from employment
The median total income from employment for the entire group of cultural and creative professionals increased during the period by 11 percent, totalling SEK 346,100 in 2021. Here too, the differences were large. The highest median income from employment was in the area industrial design, at SEK 527,800. The lowest median income from employment was in the areas solo entrepreneurs (SEK 46,500) and visual arts (SEK 57,200). In 2021, women’s median income from employment was around SEK 58,000 lower than men’s. The median income from employment was highest in the 45–54 age group, at SEK 399,550. The lowest income from employment by age was among workers aged 16 to 24, totalling SEK 121,500. The highest median income from employment by background was found in 2021 in the group foreign-born, at SEK 353,400.
Compared with other gainfully employed in the population, the median income from employment for the group of cultural and creative professionals was 7 percent lower in 2021.
Income from business activity
Since 2019 the average income from business activity has increased by 6 percent for creative professionals, corresponding to an increase of SEK 2,490. Not surprisingly, the highest income from business activity was in the area solo entrepreneurs, at SEK 118,921, followed by visual arts, at SEK 91,785. The lowest income from business activity was in the occupational area industrial design (SEK 6,436), an area with a high proportion of income from employment. For women, income from business activity in 2021 totalled SEK 43,005 compared with SEK 50,085 for men. The highest income from business activity was in the 35–44 and 45–54 age groups. The lowest income from business activity was in the youngest age group, 16–24 years. The group born in Sweden with one parent born in Sweden and one foreign-born parent had the highest income from business activity in 2021, at SEK 53,309. If the entire group of creative professionals is compared with the rest of the gainfully employed, the average income from business activity was a full 35 times higher, corresponding to SEK 45,475.
Conclusions
Wide variations in income across occupations
The group of cultural and creative professionals is a heterogeneous one. Incomes differed significantly across the various occupational areas, in terms of total earnings as well as income from employment and from business activity. Occupational areas with a majority of hybrid entrepreneurs or those who were solely self-employed generally had lower earnings compared to areas with a high percentage of income from traditional employment. This is clearly evident when we compare, for example, the areas industrial design and visual arts. Income from business activity was markedly higher in the group of cultural and creative professionals compared with other gainfully employed individuals in the population. This demonstrates that cultural and creative professionals are more likely to run their own business, and that business income often makes up a significant portion of their overall income compared to other gainfully employed individuals.
Women have lower incomes than men
Incomes within the group of cultural and creative professionals were higher for men than for women. Women working in creative professions had lower income from both employment and business activity. The income disparity between men and women also increased slightly during the period. However, this difference was slightly smaller in the cultural and creative occupational group than for other gainfully employed people. Occupational areas with high earnings, such as industrial design and online game and media design, had a high proportion of men. Compared with the other gainfully employed, the creative occupational group had higher income from business activity among both men and women.
Lowest income among young and old
The age group with the lowest income, both in terms of income from employment and business activity, was the 16–24 age group. This suggests that the labour market in these areas is highly competitive, and it can take time to establish oneself financially. Total earnings rose steadily up to the 45–54 age group and then fell slightly for the oldest age group. Median income from employment was highest in the 45–54 age group. The oldest age group, 55–65, had the greatest increase in business income between the years. This suggests that it might be harder for individuals in this age bracket to be considered for employment.
Small income differences between Swedish-born and foreign-born
Total earned income for the groups foreign-born and Swedish-born with two foreign-born parents was slightly higher than for the corresponding groups among the other gainfully employed. The average income from business activity was significantly higher for cultural and creative professionals of all backgrounds than for the other gainfully employed. However, the median income from employment was generally slightly higher for the other gainfully employed individuals compared with the creative professionals, except for the group foreign-born. One possible explanation for higher incomes among individuals with a foreign background is the presence of skilled labour immigration in the creative sectors.
Increased income despite the pandemic
Despite 2021 being a pandemic year, cultural and creative professionals earned more than they did in 2019. This is a somewhat surprising result, and it is difficult to fully explain the underlying causes. One plausible explanation is that the pandemic forced young and inexperienced people with low salaries to leave the cultural labour market and seek alternative employment. The fact sheet published by the Swedish Agency for Cultural Policy Analysis on the cultural labour market provides evidence of this.13 Another potential underlying factor is that the cultural and creative professionals group includes occupational areas that were not affected or shut down during the pandemic. For example, the Swedish computer games industry experienced an increase in turnover by more than double between 2018 and 2022.14 It is also possible that the support and initiatives put in place during the pandemic, including both direct support aimed at the cultural sector and various initiatives aimed at helping businesses and the self-employed, played a role.
Further development and investigation
The methodology developed in the 2022 collaborative study is still relatively new and needs further testing to determine any necessary changes and adjustments. In this pilot study, we aimed to examine the proportion of income from creative sectors, capital and earning by sector. However, we have chosen not to proceed with the results because they did not reveal anything noteworthy or were too uncertain to be presented.
The population we developed as part of our methodological study is diverse in terms of professions, since it includes not only persons who are professionally active as artists, but also those who work in a wider artistic context. In order to specifically capture the group targeted by government policies concerning artists, conducting studies with a more limited population is necessary. A population based on application registers from the Swedish Arts Grants Committee and the Swedish Authors’ Fund could provide a more accurate understanding of the incomes of of professional artists.
We know that the group of cultural and creative professionals is highly educated compared to other occupations in the workforce. Therefore, in future studies, it would be beneficial to consider comparing creative professionals to other similarly educated and gainfully employed occupational groups.15
In order to make comparisons with previous reports from the Swedish Arts Grants Committee, we need to conduct further studies. For example, there is a need to examine in more detail the access that creative professionals have to social security systems, as well as their level of education, disposable income, family circumstances and other relevant factors.16
Fotnoter
- Swedish Arts Grants Committee (2016), Konstnärernas demografi, inkomster och sociala villkor.
- The Kreameter was developed in partnership among the Swedish Agency for Economic and Regional Growth, Swedish Agency for Cultural Policy Analysis, Swedish Agency for Growth Policy Analysis, Swedish Arts Council and Statistics Sweden, on behalf of the government.
- In 2018, Eurostat updated the list in its Guide to Eurostat Culture Statistics – 2018 edition.
- SSYK 2012 is based on the International Standard Classification of Occupations 2008 (ISCO–08)
- European Union (2023). Report from the OMC working group.
- Government letter (2023/24:11)
- Swedish Agency for Cultural Policy Analysis and Swedish Arts Grants Committee (2022)
- In 2024, no tax needs to be paid if a person earns less than SEK 24,238
- https://www.scb.se/lisa
- This method of analysis involves combining labour statistics and business statistics. It is known worldwide as the Creative Trident.
- Swedish Arts Grants Committee (2016), Konstnärernas demografi, inkomster och sociala villkor
- In the methodological study Professional artists in SCB’s registers (2022), this group was called Scen och film (“Stage and film”)
- Swedish Agency for Cultural Policy Analysis (2023), Kulturarbetsmarknaden efter pandemin
- Government letter (2023/24:11), Strategi för kulturella och kreativa branscher (p. 5)
- Swedish Arts Grants Committee (2016), Konstnärernas demografi, inkomster och sociala villkor
- Swedish Arts Grants Committee (2016), Konstnärernas demografi, inkomster och sociala villkor